Design Question
Project Overview
How might we design a system that promotes and incentivizes climate-conscious food choices among UW students who order food from on-campus dining establishments?
For my class at the University of Washington, we were tasked with creating a solution to the class theme of:
Designing for Climate Change
To do, so we create a points-based rewards system, paired with a carbon impact grading system for on-campus dining establishments at UW.
DubGrub Rewards✴️
Overview.
DubGrub rewards is a system that rewards users for choosing climate-friendly food choices.
Project
UX Research
UX Design
My Role
User Researcher
Duration
9 Weeks
Sept - Dec 2022
Research Methods
Usability Testing
Contextual Inquiry
Field Interviews
Quantitative Survey
Team
Alex - Research
Maomao Ding - Design
Marianna Nam - Design
Swathi Balaji - Design


Why?
“Meat and dairy provide just 18% of calories consumed but use 83 percent of global farmland and are responsible for 60% of agriculture’s greenhouse gas emissions.”

Product Space.
Many consultancies rate and grade food according to climate impact including Eaternity, EcoScore, and My Emissions. However, these systems have several pain points that we seek to address:
They are fractures across a wide variety of companies with different non-translatable methodologies.
They have opaque and difficult-to-understand methodologies and practices.
They are sparsely used, particularly outside of Europe.
Most importantly, none of them are used at the University of Washington.

Generative User Research
Research Questions
What are people’s decision-making processes when deciding what to eat?
Do students consider the climate impact of their choices when ordering food?
Do students want more information regarding the impact of their choices? Would additional information alter their decision?
How do students conceptualize incentives regarding making more sustainable choices?
Target Sampling Population
Primarily UW undergraduate students that dine at on-campus dining establishments.
To achieve gather data from this user population, we decided it would be best to adopt guerilla UX research methods and randomly sample students in public.
Research Methods
Field Interviews
Why?
Achieve a random sampling of users in spots frequented by undergraduates at UW,
Allows for more interactivity than contextual inquiry,
Semi-structured question format allows for diverse conversations and solution exploration.
How?
We conducted 10 (n =10) field interviews with students chosen at random on the UW campus.
Each interview lasted ~5 minutes. During the interviews, we encouraged ourselves to ask follow-up questions based on the answers individuals provided and to dive deep into issues that are explicitly linked to our design questions.
Goals.
More solid understanding of the users’ backgrounds,
Motivations and behaviors when dining, particularly on campus,
Pain points about their eating habits and climate concerns,
Elicit potential user-driven solutions to our design problem.

Contextual Inquiry
Why?
Learn how users think by observing their verbal and non-verbal cues.
Paint an accurate image of user concerns towards climate change by understanding their passing thoughts and suggestions on topics like sustainability, carbon footprint, plant-based diets, etc.
We wanted to observe establishments to understand the current state of sustainability in the food service industry.
How?
We conducted 7 (n = 7) inquiries at food establishments at and around UW.
We observed as they ordered their lunch. We picked their brain via. prompts and probes to understand their reasoning behind their food and location choices that day.
Goals.
Discerning users’ thoughts and deliberations while in the context of ordering food,
We also tried to gather the participants' current stance on climate change and the potential for lifestyle changes,
Understand how this thought process ties into sustainable food ordering.
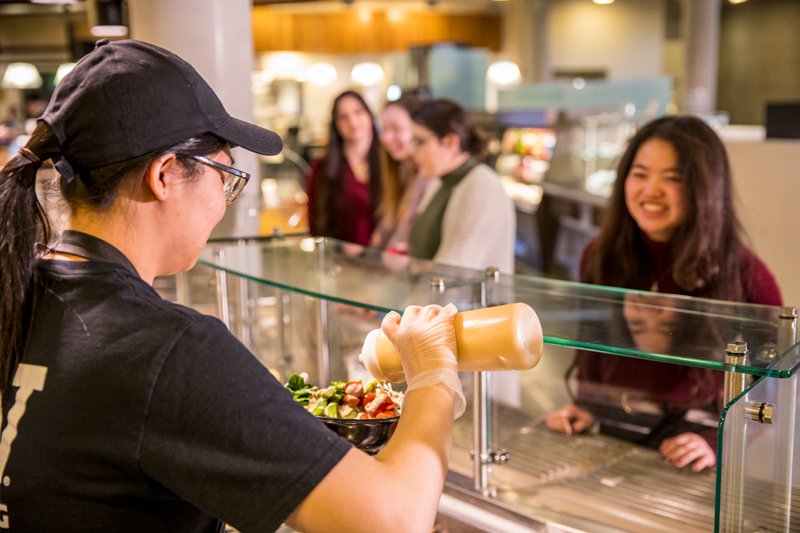
Conducting a field interview
Quantitative Survey
Why?
Expand our sample size beyond the interviews and contextual inquiries from a larger, more diverse survey (beyond Seattle),
Gather a concrete ranking of factors affecting food choices, and willingness to change climate-related behaviors,
How?
Collected 53 (n = 53) survey responses
Distributed an online Qualtrics survey
Goals.
Elicit a wider variety of data from a larger sample population
Dining habits & constitution,
Willingness to increase & decrease each food group they consume,
Level of climate change concern,
Factors impacting their food choice,
Potential motivators towards more sustainable food choices.


Generative Research Findings
Factors Affecting Food Choice
| Factors | Avg. Ranking | # of Participants |
|---|---|---|
| Price | 2.30 | 43 |
| Taste | 2.36 | 42 |
| Health | 2.92 | 40 |
| Convenience | 3.22 | 36 |
| Familiarity | 4.22 | 27 |
| Natural Ingredients | 4.57 | 23 |
| Ethically Sourced | 4.06 | 16 |
| Climate Impact | 4.83 | 6 |
We learned that climate impact was perhaps the least important factor affecting students’ food choices. As seen in the table to the right - price, taste, health, convenience, and familiarity rank highly.
This was confirmed by our qualitative research as well:
Q: Generally, when you're picking restaurants, what kind of factors do you consider?
A: “I’ll consider the taste and the price the most. I also check reviews online such as Google reviews.” - P9, field interviews
Food Choice Factors.
For this question, participants selected factors from a list that they considered when ordering food, then rank those factors.
| Intervention | Avg. Ranking | # of Participants Voicing Support |
|---|---|---|
| Discounted pricing | 1.49 | 41 |
| Convenience (i.e., proximity, food preparation time, etc.) |
2.36 | 39 |
| Information on health benefits of sustainable food consumption |
2.80 | 25 |
| Rewards system | 2.92 | 25 |
| Social accountability (family/friends) |
2.78 | 18 |
| Increased visibility of “low-emissions” items |
2.93 | 15 |
| Other (Please Specify) | N/A | 0 |
Solution Rankings
Again, participants checked factors from a list of solutions, and ranked those solutions.
Well-Aligned Solutions
We also learned that the solutions that users supported were highly aligned with the food choice factors.
However, our qualitative results told a slightly different story this time, illustrating that some users want to learn additional information regarding the carbon impact of their food.
Q: Is there anything that restaurants can help you make more informed decisions about the climate impact of your food choices?
A: “I care but there's not much information about it. If they provide information on where the food is from or … I will probably care.” - P9
A: “Definitely if they put up posters or something informative saying here's why you should not eat like this certain foods. This could be cool because I know they're always posting posters everywhere.” - P7
A: “I think I would like to be informed, not sure how much of an impact it will have, but having that information gives me choices.” - P10
Qualitative Findings
13 of 17 users are somewhat concerned about the environment,
5 are currently engaged in efforts to reduce their own carbon footprint to address climate change,
Among users concerned about this climate change but don’t factor the environment into their food choices:
They are uninformed of the influence of their food and would like to be educated about their climate impact.
Contextual Inquiry Findings
Most of the users decided what to eat in a couple of minutes or less.
Those who took a bit more time to decide reviewed the menu items from one spot, then perused the options at other nearby establishments before making their decision.
There were a handful of lower emission menu items (i.e., vegan meat alternatives, or meat-free meals), however, the majority of students we observed did not opt for these items.
“I’m not aware of how the different selections can have an impact on climate. What is that? Would you elaborate?
I think I would like to be informed, not sure how much of an impact it will have, but having that information gives me choices.”
Design Inspiration
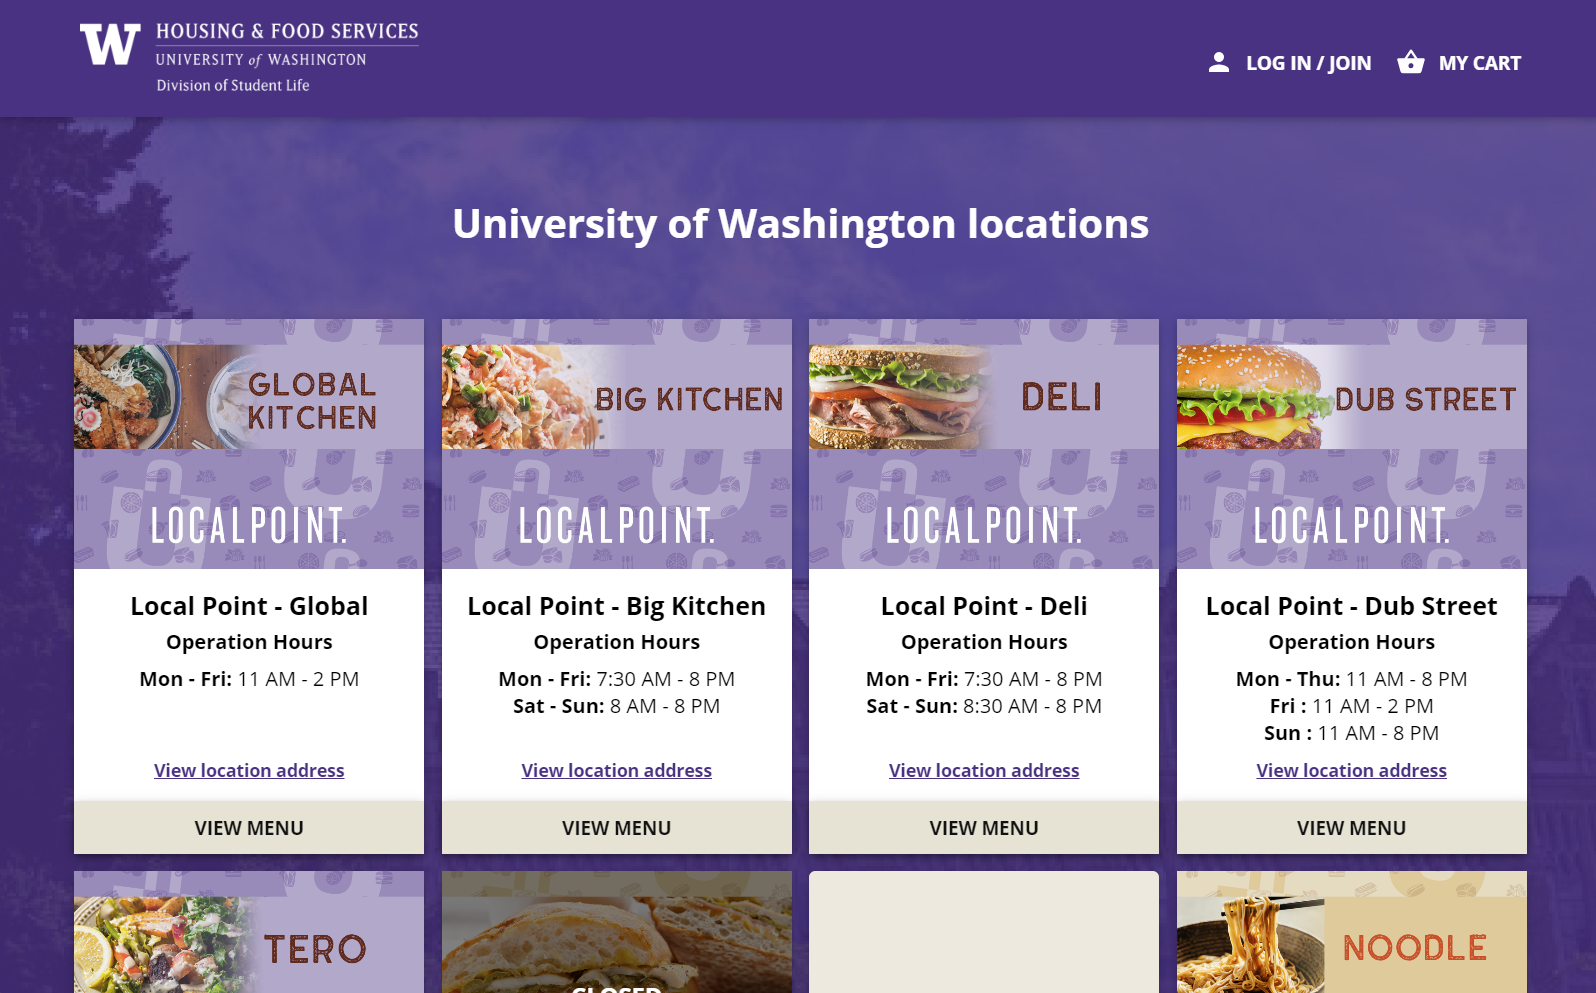
We wanted to emulate and improve on the design of UW’s existing ordering platform, DubGrub.
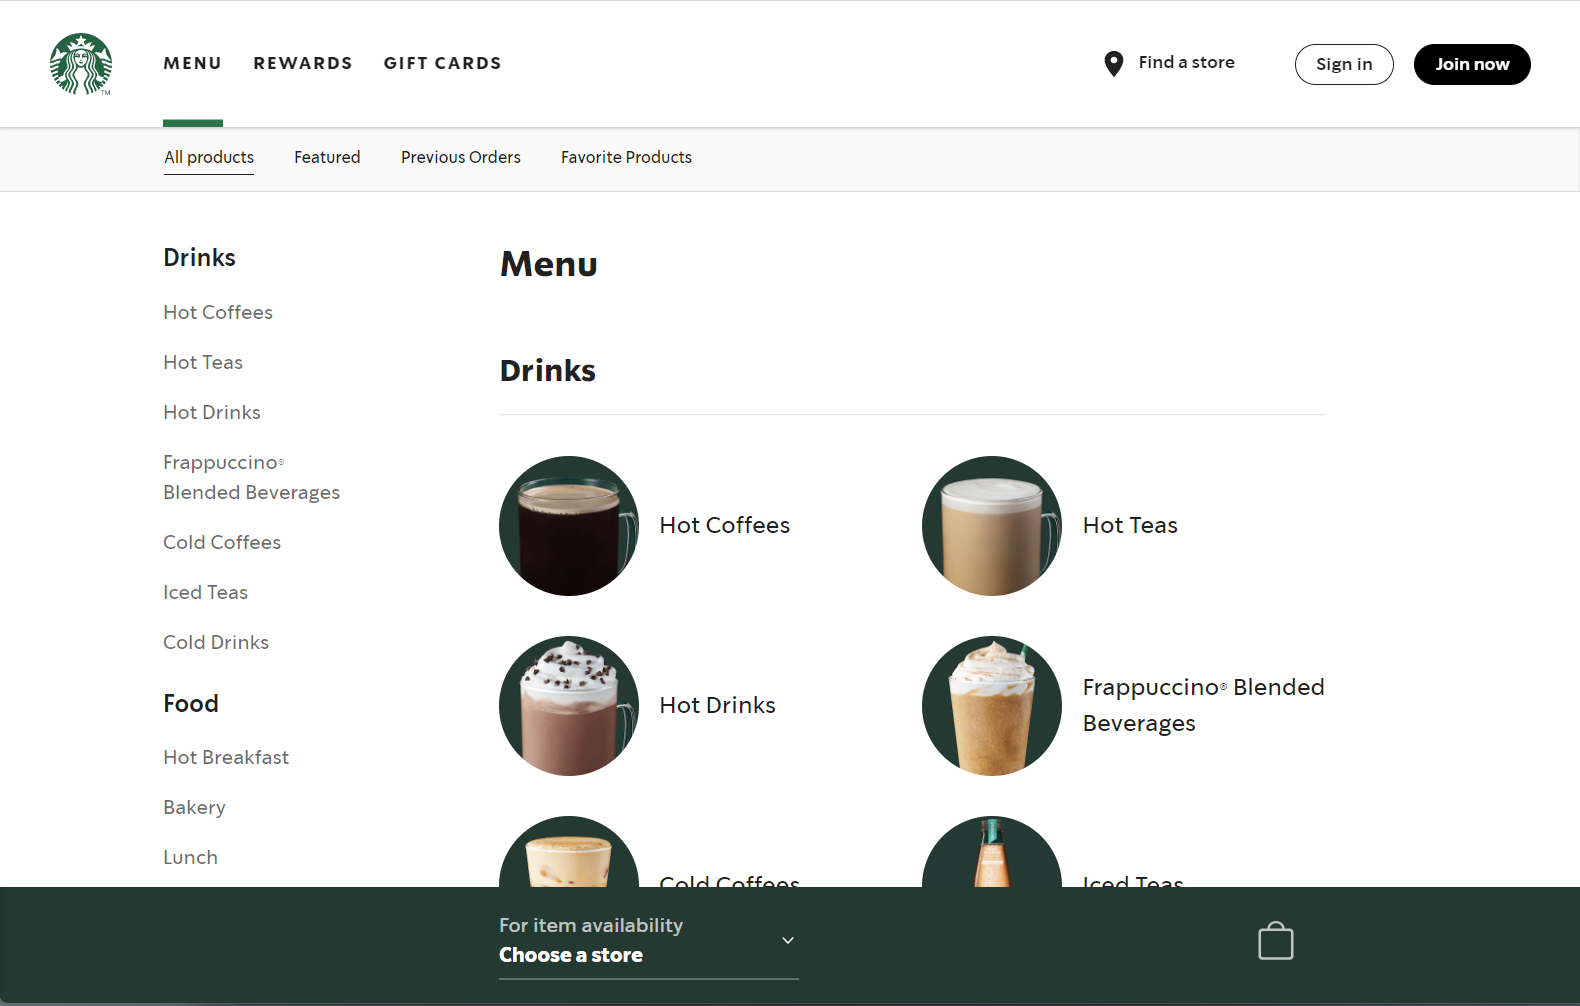
We also chose to modernize it by looking to other ordering platforms like Starbucks and Chipotle for inspiration.
Interactive Figma Prototype
Please use this interactable Figma prototype we built!
There are two primary features in this prototype:
Onboarding, learning about the new systems,
Ordering food items and earning points.

Usability Testing
Live, Observation Testing
We conducted non-guided observational usability tests followed by a post-test semi-structured interview using our mid-fidelity prototype with seven (n = 7) users. Testing and interviewing lasted between 20 and 35 minutes.
We tested two primary user flows with users, one as an initial onboarding introduction task, and the other as a food ordering flow.

I began by simply observing the user interact with the prototype as they would naturally.
I also instructed them to think aloud so I could learn their thoughts without questions.
My research goals included:
Is our interface easily navigable? Where are the points of confusion?
Are the systems we designed understandable?
These systems include ordering, green grades, rewards, and personal sustainability scores.
How can we better design our systems or their explanations for easier interpretability?
Are our incentives compelling to achieve our goal of nudging to lower emissions food choices?
If rolled out into real life, would our participants use such a system?
How can we improve the systems to better design for behavior change?
Live Usability Testing
Research Goals
| Participant ID | Onboarding Flow | Food Ordering Flow |
|---|---|---|
| 1 | ✅ | ❌ |
| 2 | ✅ | ✅ |
| 3 | ✅ | ✅ |
| 4 | ✅ | ✅ |
| 5 | ✅ | ✅ |
| 6 | ❌ | ✅ |
| 7 | ✅ | ✅ |
Usability Testing Participants
Usability Testing Findings
-
Points Based Rewards ✴️
We learned that the cognitive and educational burden was too high in our original system, so we wanted to replicate the design & system of familiar restaurants like Starbucks and Chipotle.
-
Reduce Onboarding Length ✍️
This is particularly helpful for users that ignore our on-boarding tutorial, which some usability participants did. We also learned to reduce the tutorial in length and wordiness.
-
Embed Educational Material 🧠
We also learned to rely less on the onboarding process to educate users on our systems, instead embedding more educational info directly to the site.
-
Emphasize Key Additions 🗝️
Users discussed that they would like to see the major differences that this system provides from the existing DubGrub ordering platform highlighted better.
-
Carbon Emission Interpretability ☁️
Users found our carbon emissions values confusing and would like to have better contextualization, i.e. number of trees, kgs of beef.
-
Larger Iconography ▶️
Some users believed that many of our icons and labels were too small. They also mentioned that the design of our icons were quite complex for their small size.
Final Deliverable Poster.
I presented this poster to my professors and classmates as a way to educate stakeholders on our results.


